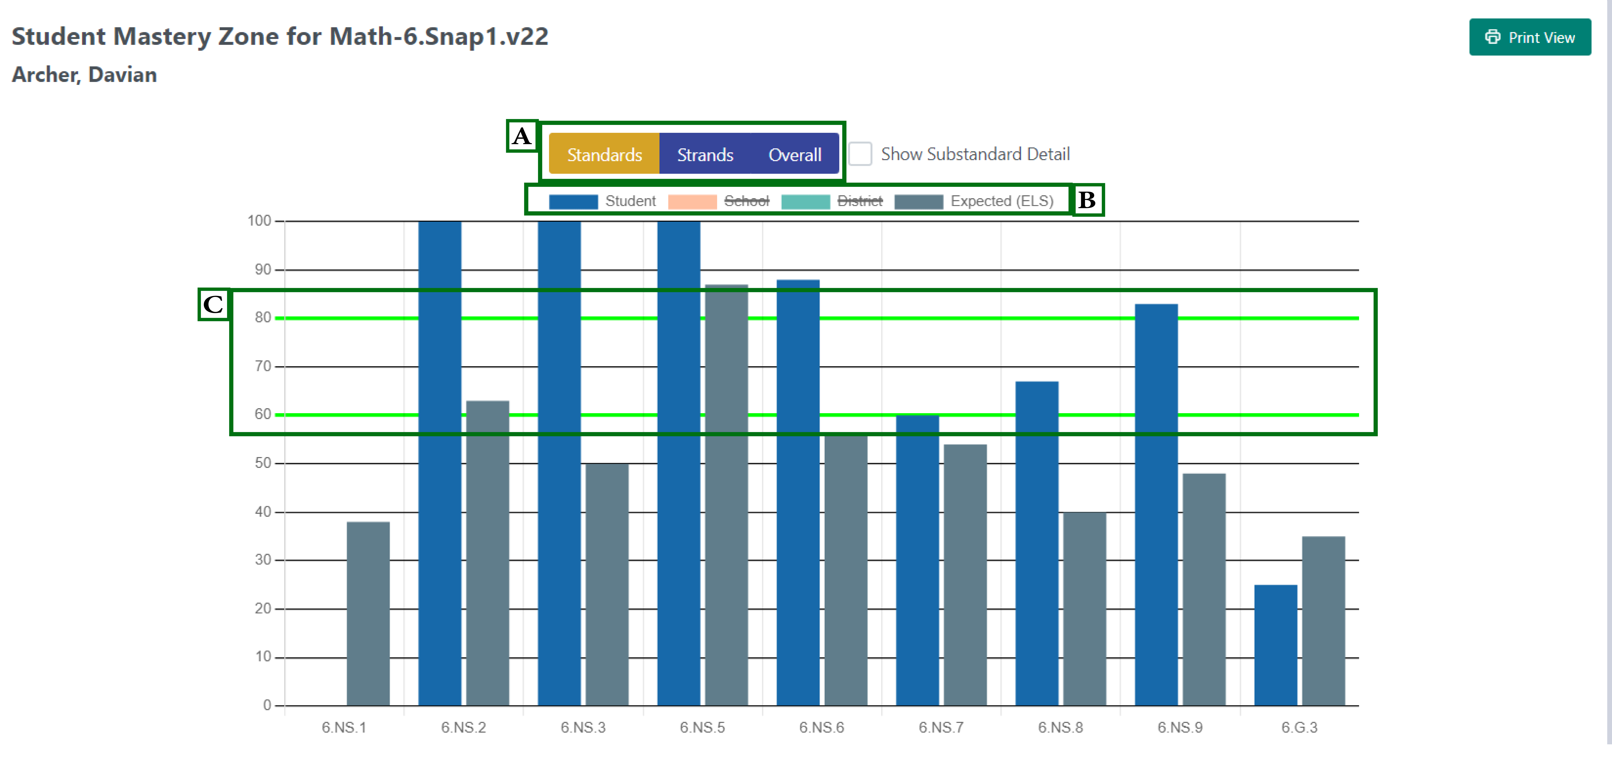
Choose whether to view data sorted by Standard, Strand, or Overall performance on the given assessment.
Choose the comparison(s) you wish to view on the graph by clicking School, District, or expected (ELS). Expected (ELS) will only be an option if there is a baseline state assessment score for the subject from the previous year.
The green lines at 60% and 80% provide a frame of reference for educators to measure content mastery for standards and strands. On benchmark assessments, generally speaking, 60% represents proficiency and 80% represents advanced performance.
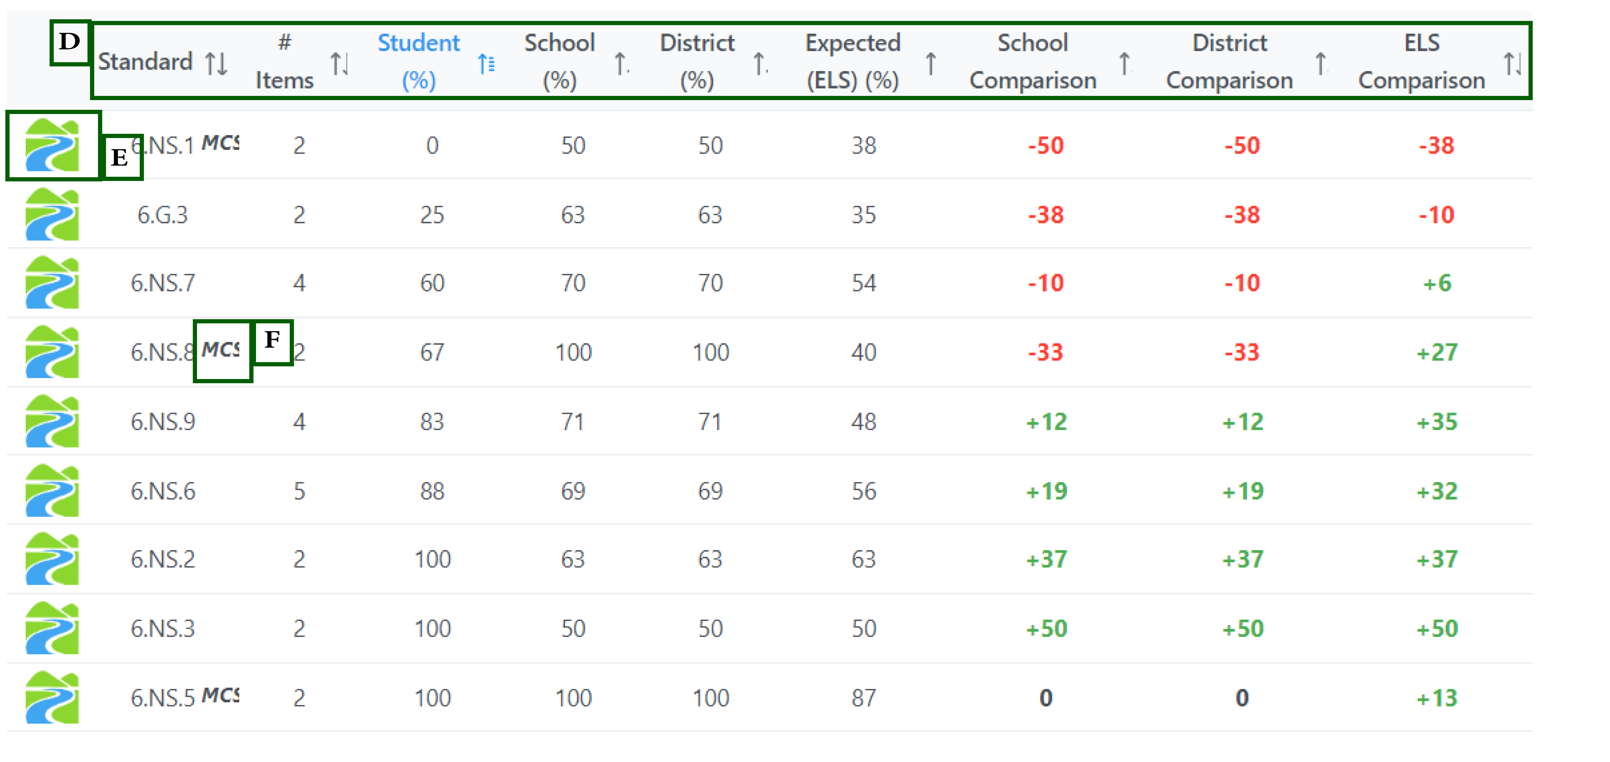
To sort the list by a column, click on the title of that column.
Click on the Pathways logo to find lesson planning resources and worksheet/online reviews for each standard.
Major Cluster Standard (MCS) indicates that the standard will show up more frequently on the state assessment. In ELA, this classification is referred to as “Power Standard.”
Was this article helpful?
That’s Great!
Thank you for your feedback
Sorry! We couldn't be helpful
Thank you for your feedback
Feedback sent
We appreciate your effort and will try to fix the article