The Group Results report, available to administrative users only, displays assessment data for groups of students (e.g., schools, teachers, subgroups), including the number tested and percent correct. The report can also be used to view individual student results.
For Snapshot and Benchmark assessments, the report additionally includes projected proficiency and growth.
Districts that have purchased Advanced Reporting also see cohort comparison data. The cohort comparison shows a group’s performance relative to peers who scored similarly on the prior state assessment.
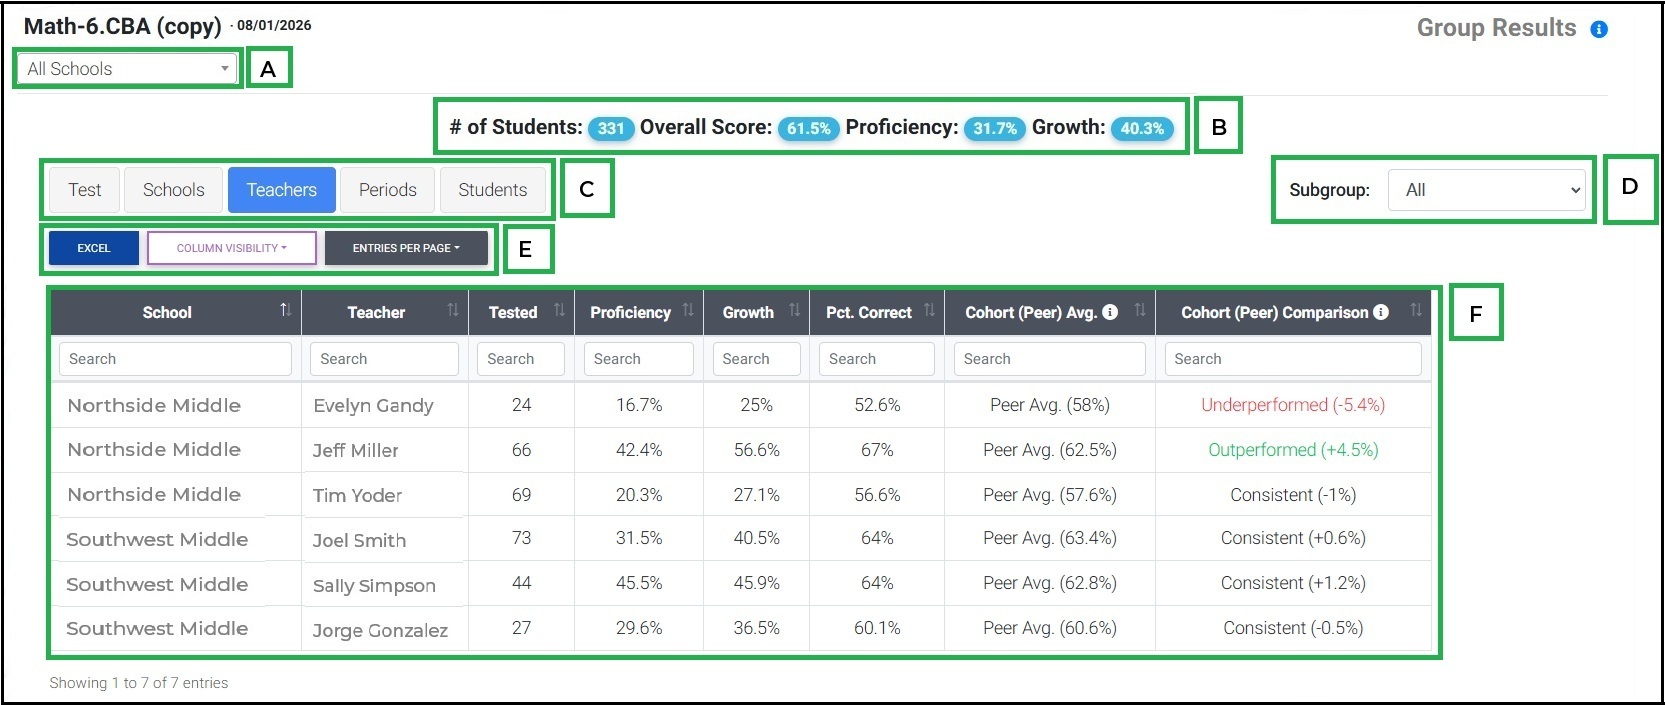
Select school, teacher and/or period to view.
General assessment information and averages for selected groups.
Level of group summary (test, schools, teachers, periods, students)
Subgroup filter (note: data only available if district is sharing subgroup data)
Report Actions:
Excel- download results into an excel document
Column Visibility- show or hide columns
Entries Per Page- choose the number of records to show on each page
Group results, including school, teacher, period, proficiency, growth, percentage correct, cohort (peer) average*, and cohort (peer comparison)*
* only available for districts who have purchased Advanced Reporting.
Was this article helpful?
That’s Great!
Thank you for your feedback
Sorry! We couldn't be helpful
Thank you for your feedback
Feedback sent
We appreciate your effort and will try to fix the article